Have any questions?
- Guntur +91 7997927111
- Vijayawada+91 9985858639
Tableau Course Institute in Vijayawada
✓
✓
✓
Tableau Course in Vijayawada
The Tableau Course at Nipuna Technologies, Vijayawada, is designed to help students and professionals master the art of data visualization and business intelligence. This course provides a complete understanding of how to connect, analyze, and visualize data using Tableau’s powerful tools and interactive dashboards.
You’ll learn how to transform raw data into meaningful insights, create dynamic reports, and present business trends visually for smarter decision-making. The training includes real-time projects and case studies, ensuring hands-on experience with live datasets.
By the end of the course, you’ll be proficient in using Tableau for data analytics, dashboard creation, and business reporting. Upon successful completion, Nipuna Technologies will award an Industry-Recognized Tableau Certification, enhancing your profile and opening up opportunities in Data Analysis, Business Intelligence, and Visualization roles.
Key Highlights:
-
Comprehensive, hands-on Tableau training
-
Real-time project implementation
-
Data analytics and visualization practice
-
Expert trainer guidance
-
Placement assistance and certification
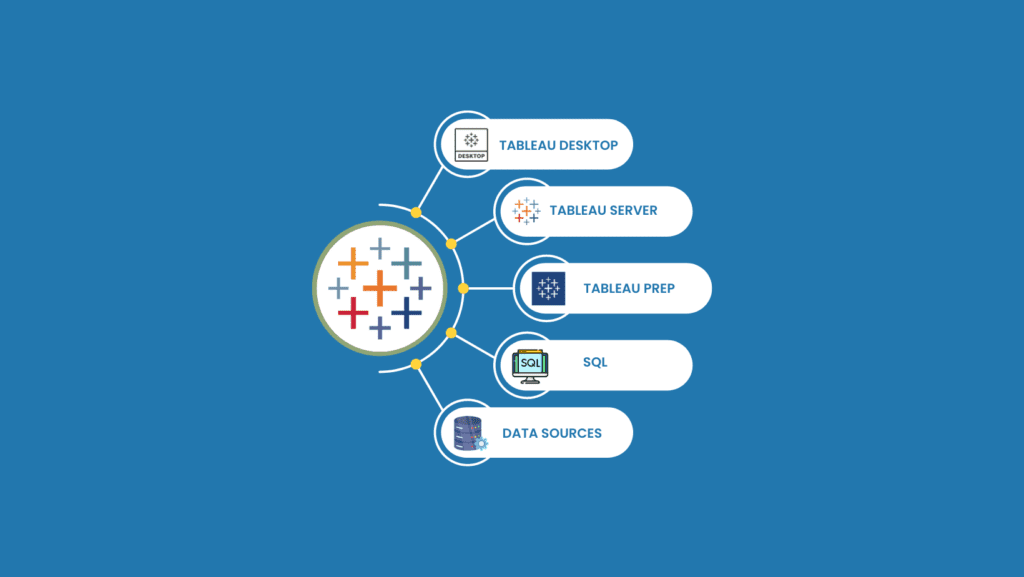
Tableau Course Curriculum
- What is tableau
- Getting Started with Excel
- Download and Install Tableau Public
- How to Load Data from Excel
- User Interface of Tableau
- Core Topics in Tableau
- Dimensions vs Measures
- Discrete vs Continuous
- Implementation of Discrete and Continuous Fields
- Aggregation in Tableau
- To Create Charts in Tableau
- Bar Chart
- Stacked Bar Char
- Line Chart
- Scatter Plot
- Dual-Axis Charts
- Combined-Axis Charts
- Funnel Chart
- Cross Tabs
- Highlight Tables
- Maps
- How to Measure Names and Measure Values
- What is Data Types
- Sort Columns, Hide, Rename, and Unhide
- Default Properties of Fields in Tableau
- To create Filters in Tableau
- Dimension Filter
- Date Filter
- Measure Filter
- Visual filter
- Interactive Filter
- Data Source Filter
- Context Filter
- Sets
- Parameters
- Group
- Calculated Fields
- Date Functions
- Text Functions
- Bins and Histogram
- Sort
- Reference and Trend Lines
- Table Calculations
- Pareto Chart
- Waterfall Chart
- To create Dashboards and stories
- How to Work with Layouts
- Objects in Dashboard
- Making Dashboards Interactive
- Actions in Dashboard
- Best Practices for Dashboard Creation
- Dashboard for Mobile
- Modifications to Data Connections
- How to Edit Data Source
- Unions Joins
- Data blending
- Levels of Details
- Introduction to Level of Detail (LOD)
- Fixed LOD
- Include LOD
- Exclude LOD
- How to Publish in Tableau Public
Tableau Course Course Key Features

Practice Labs For Real-Time Learning

Live Project Training

Classroom Training

24/7 Support

Job & Interview Assistance

Internship After Course
Job Opportunities After Completing Tableau Course in Vijayawada
Data Analyst
Business Analyst
Tableau Consultant
Business Intelligence Developer
Business Intelligence Manager
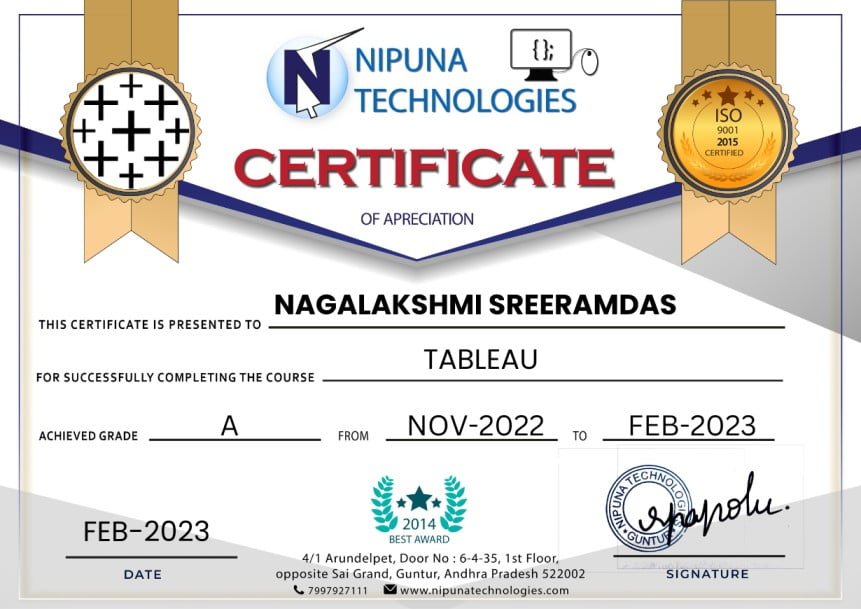
Tableau Course Completion Certifications
Our training is based on the latest cutting-edge infrastructure and technology, ensuring you are fully industry-ready. Nipuna Technologies will present this certificate to students or employee trainees upon successful completion of the Tableau Course, which will enhance and strengthen their resumes, helping them explore numerous career opportunities in the fields of Data Visualization, Business Intelligence, and Data Analytics.
Student Reviews
Hear what our students have to say about their learning experience with Nipuna Technologies.

Praveen Kumar

Nagasai Krishna

Supriya

Sunil Kumar

Anudeep Ande

Majeti Priya

Vishnupriya
SAP FICO Course Training - Frequently Asked Questions
Course
Others Feature Courses
React JS Course Training Institute In Guntur
Learn React JS from Industry Experts Enroll in our meticulously crafted React JS course in Guntur, thoughtfully designed and expertly delivered by industry leaders. Our instructors, armed with years of immersive…
Tally with GST Training Course In Vijayawada
Why Choose Nipuna Technologies for Tally with GST Course Training in Vijayawada? Our Tally with GST training program has been designed by expert trainers for students to get maximum in-depth…
React JS Course Training Institute In Vijayawada
Learn React JS from Industry Experts Enroll in our meticulously crafted React JS course in Vijayawada, thoughtfully designed and expertly delivered by industry leaders. Our instructors, armed with years of immersive…
Machine Learning Python Course Institute In Vijayawada
What is Machine Learning with Python Course? Machine learning is a branch of artificial intelligence that focuses on making algorithms and statistical models so that computer systems can get better…
Python Django Course Institute In Vijayawada
Why Choose Nipuna Technologies for Python Django Course in Vijayawada? Our Python Django Course program has been designed by expert trainers for students to get the maximum in-depth knowledge with…
Python Full Stack Course In Vijayawada
Why Choose Nipuna Technologies for Python Full Stack Course in Vijayawada? Nipuna Technologies, the best online Python Full Stack Course providing institute in Vijayawada, offers a Python Full Stack Course learning course…
Python Core & Advanced Course Institute In Vijayawada
Why Choose Nipuna Technologies for Python Core & Advanced Course in Vijayawada Because of the expanding relevance of the latest technologies, such as Data Science, Machine Learning, and so on,…
Power BI Course Training Institute in Vijayawada
Start Your Career in Data Analytics Embarking on a dynamic career in data analytics paves the way for a plethora of opportunities spanning diverse sectors. From the realm of finance…
PHP MySQL Training Institute In Vijayawada
Why Choose Nipuna Technologies for PHP MySQL Training in Vijayawada? Our PHP and MySQL training program in Vijayawada has been designed by expert trainers for students to get the maximum in-depth…